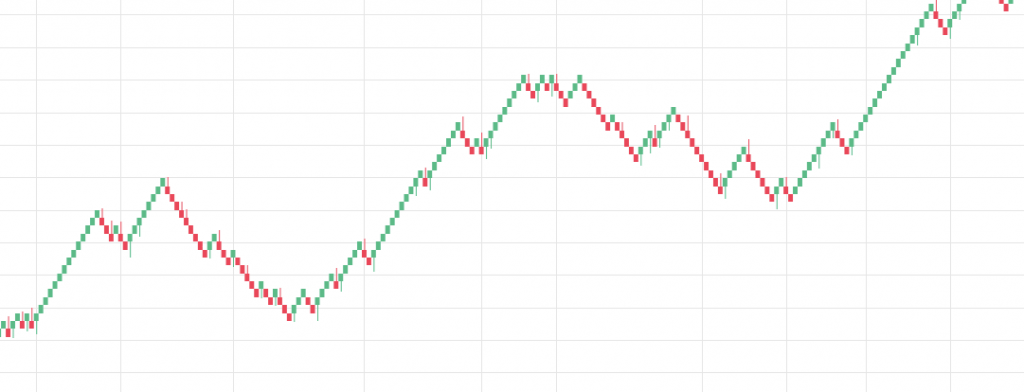
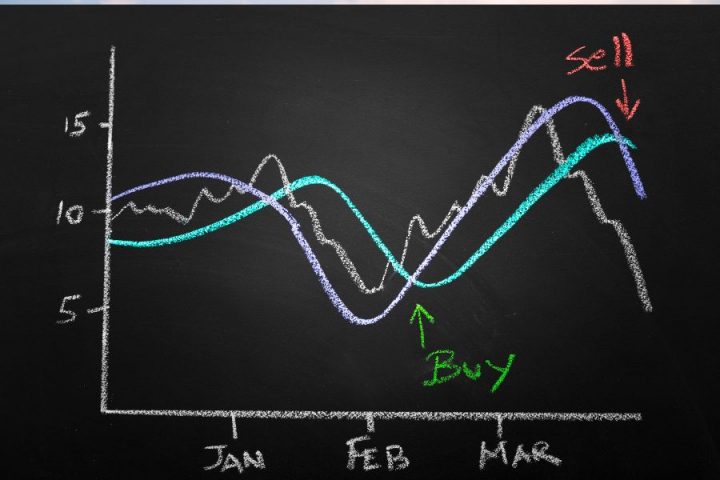
Technical analysis in forex trading focuses on price movements and chart patterns. Generally, traders look for patterns in candlesticks and price bars. These patterns indicate that the price is undergoing consolidation or will move upward or downward. For example, a bearish “head and shoulders” pattern contains 13 candlesticks. That means that there will likely be a downward movement in price. In this case, it’s a good idea to buy and sell at that time.
Bollinger bands
Traders can utilize Bollinger Bands to analyze charts. These bands determine the strength of falling and strengthening trends and can also indicate when an asset may reverse. Bollinger Bands are most useful for trend-following trading, but their information is not always accurate.
The bandwidths (or standard deviations) are important when it comes to identifying potential entry and exit points. A wide range of Bollinger Bands can help identify entry and exit points on a chart. Since they can be easily visualized, they are an ideal tool for technical analysis. Bollinger Bands were introduced by John Bollinger in 1983 and have proven to be an extremely useful technical analysis tool. This tool is often used in combination with other indicators, such as moving averages and RSI, to determine a trade entry or exit point.
Stochastics
Forex traders often use Stochastics in their technical analysis strategies. They look for highs and lows, crossovers, and divergences. They use these signals to look for buy and sell signals and often confirm them with other technical indicators. But the use of Stochastics indicator signals is not without its risks. You will need experience and a certain amount of knowledge before you can start trading with it.
A stochastic oscillator has many uses. While the momentum oscillator is a useful indicator, it will likely produce substandard results. The best use of a stochastic oscillator is for confirmation purposes, and a crossover out of oversold territory will add weight to your trade. Another useful use of Stochastics in technical analysis in forex trading is when it displays a positive divergence signal.
Fibonacci number
If you’ve been looking for a way to increase your margins and make more money in forex trading, you’ve probably heard of Fibonacci numbers. But what is the significance of this sequence? This pattern is known to be scientific because it has been used by traders since the 1500s to mark reversal points. But interpreting it can be tricky. While Fibonacci levels work in some cases, they often do not.
A trader can use Fibonacci retracements to determine price targets, stop-loss levels, and entry orders. In fact, this indicator is often combined with other indicators to make better trading decisions and assess trends.
Line chart

The line chart is a popular technical analysis tool, particularly in the currency trading sector. While it may not give as much detail as other types of charts, a line chart is ideal for revealing trends and comparing closing prices visually. Line charts are most effective for trend analysis, and the slope of the line indicates how strong the trend is. Here are a few tips for using a line chart. They can be useful in combination with other charts to provide additional insights.
A line chart is the simplest of the different types of technical analysis charts. It represents the price action of an asset by connecting different data points with a single continuous line. The line can be drawn over any period of time but typically shows closing prices. This type of chart is best suited for day-to-day trading; as the data it displays is generally day-to-day. It is not a good way to make decisions, however, because it lacks visual information, such as trading ranges and opening prices.
Trend line
A trend line is a series of price patterns connected by a slope. Depending on the market conditions, an upward or downward trend line can be drawn on the chart. Generally, traders draw upward trend lines by connecting successive closes and lows of the periods. In forex trading, an upward trend line is drawn on the chart when the price of an asset is headed upward. A downward trend line is drawn when the price of an asset is headed downward.
In the forex market, trendlines are especially useful for traders using short-term strategies. These traders typically purchase currency pairs at the onset of an uptrend and sell them at the peak of a trendline. Short-term traders tend to focus on price action only and do not study the other fundamental factors that may be more relevant for long-term trading. In forex trading, however, trendlines can help identify market sentiment by predicting price movements.
