There are several methods for predicting price movements in the forex market. These include Neural networks, Fundamental analysis, economical calendar, and technical analysis. Nevertheless, each method has its own benefits and limitations. Before investing in forex, you should learn more about each technique. This way, you will be able to decide which one is most suitable for your trading strategy. You should also learn about the risks involved in forex trading and the time frame required for its implementation.
Fundamental Analysis

Fundamental analysis is an analysis technique that attempts to forecast currency price movements based on the economic factors influencing a particular country. The process is based on various economic indicators, societal factors, and government policy. Fundamental analysis also accounts for the supply and demand of a currency, which determines its price. Proponents of the method also examine various economic data, such as business cycles and interest rates. This helps them predict the price movement of currencies in the Forex market.
This method works by studying the fundamentals of a country, which is everything that makes that nation tick. For example, a nation may have low unemployment, a high current account surplus, or a high productivity rate. However, this doesn’t mean that the currency will perform well against other nations. In order to successfully predict currency price movements, it is important to understand which factors have the most influence on the currency’s value.
Technical Analysis
The two major approaches to analyzing the forex market are fundamental analysis and technical analysis. Fundamental analysis looks for reasons for a currency’s price movement, while technical analysis concentrates on past events that have affected the price. Using both approaches can increase your chances of success and minimize their individual drawbacks. Fundamental analysis is often criticized for being a ‘random walk’ – it simply appoints a news story or data to a price movement without determining the cause. Moreover, a technical analyst’s approach will not give you a competitive advantage over the other methods, and the same is true for technical analysis.
Predicting price movements in forex using technical analyses is possible only when you are familiar with the fundamentals of currency trading. In other words, it is difficult to predict price movements without prior knowledge of the market. The most common approach to technical analysis is econometric analysis, where traders select factors that influence currency prices the most. Typically, these variables include the opening and closing prices of currencies. These factors are then injected into a general calculation that generates a prediction for future market movements.
Neural Networks
Neural networks are based on the use of multiple connected layers of neurons that receive input signals and compute output using matrix operations and nonlinear transformations. The neural network uses time-series data as input and forecasts the price based on these signals. They have one input layer and one output layer, and either one or more hidden layers. The connections between neurons carry weight, and the neural network is trained to tune the weights of each neuron.
The use of neural networks for predicting price movements in forex has a number of benefits. This system is capable of generating accurate trading ideas. But before you use it to trade, you should ensure its accuracy. The best way to ensure that your predictions are accurate is to generate your own trading ideas and make sure you know what you want to get out of them. You should also define your expectations and the purpose of your trading idea clearly. This stage of the network preparation cycle is the most crucial. Next, you must try to improve the overall quality of your network by modifying the data set and changing the parameters.
Economic Calendar

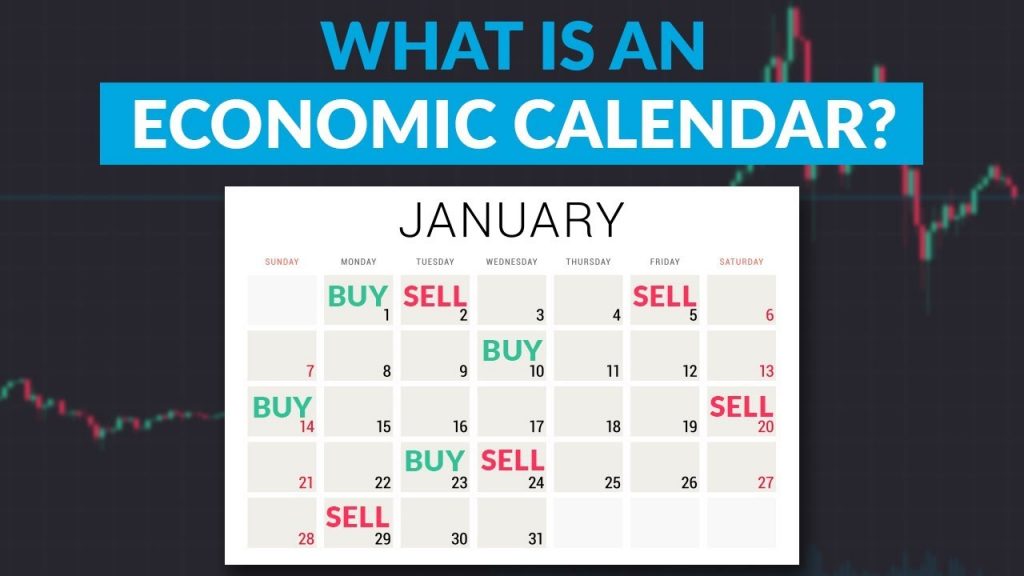
An economic calendar turns out to be an indispensable tool for predicting price movements in the forex market. It provides a snapshot of important events that impact markets, such as economic news or elections. It allows users to select which events they want to follow and to view events both in the past and in the future. Some economic calendars include time zones from different locations, so traders on the US East Coast can choose Eastern Standard Time instead of GMT-4 or GMT-5. Users can filter events by importance and country to see only the important ones.
A forex calendar is especially useful for retrospective analysis. Learning to trade forex involves studying past market data, which can prove invaluable as you practice your skills. Though there are many indicators, strategies, and signals that can help you make the right trades, price movement alone does not tell the entire story. In fact, macroeconomic events can be even more helpful in predicting price movements, as they provide a history of how the market reacted to past events.
Identifying Directional Movement
When you’re trying to determine a trend, you may want to look at a directional indicator. The average directional index (ADX) is a momentum indicator that can help you determine which direction a currency is trending. It works in conjunction with a price chart by plotting a single line, and it can also help you identify major price fluctuations. Breakouts are the result of sudden momentum, usually resulting from an increase in supply or demand. If the ADX rises, you might want to consider short-selling your position and buying it back. If you’re doubtful, you can always consult with a professional to learn how to identify directional movement in forex.
The average directional index was first developed by Welles Wilder. It was initially used to trade commodity futures but has since been applied to virtually every type of tradeable investment. Wilder’s index is a combination of two indicators, the plus directional indicator (+DI) and the minus directional indicator (-DI). Both of these indicators measure the direction of a trend based on highs and lows.
